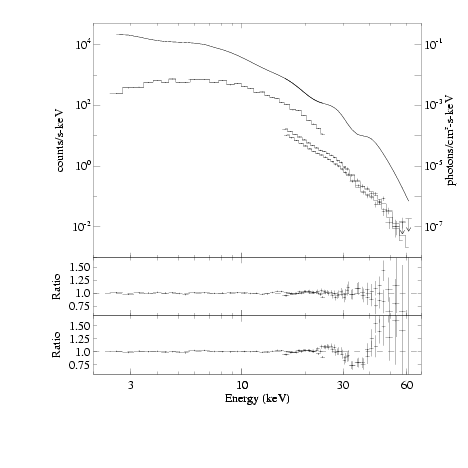
Spectrum 1: Heindl et al. (1999)
Model: PHABS x (BLACKBODY + POWER x FDCO x GABS x GABS x GABS)
Description of the figure (see also caption of Fig. 3 of Heindl et
al., 1999):
PCA and HEXTE count spectra for pulse phase 0.70-0.76.
Also shown are the best fit model (histograms) with 3 CRSFs and the
inferred incident spectrum (smooth curve).
Middle: The ratio of the data to the best fit model.
Bottom: The ratio of the data to a model fit with only
two CRSFs. The residuals between 30-40 keV and the underprediction
of the continuum above 40 keV emphasize the presence of the third
line.

|
Last modification date: Fri Aug 3 01:06:13 2007
|
